Our Case Study
A customer of ours was experiencing sporadic loss of packets while users were utilizing a connection proxied via Citrix NetScaler. Not everyone was affected and happening once-twice a day, making it extremely difficult to make traces, identify sessions and catch the root cause. We had to prove the loss wasn't happening on the NetScaler and to identify if was heppening before or after our proxy.
So we're here to talk about capturing modes and packet analysis for detection of such issues.
You should always thoroughly examine your device before shifting to the other part of the network. The more functions a device has the bigger the probability of something going south. The switch is probably doing fine.
Packets buffered for transmission (TXB) vs Transmitted Packets (TX)
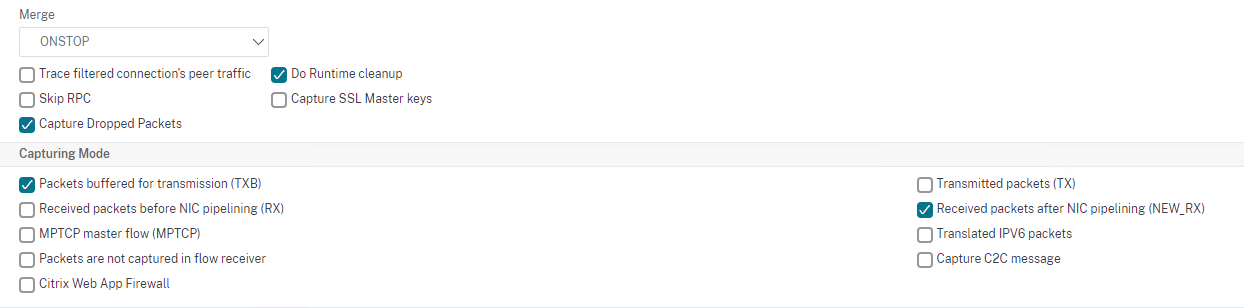
Let's start with the swiss army knife of networking. The NetScaler has different capturing modes when starting a trace. TXB + NEW_RX the default mode, but there’s another RX + TX mode. What’s the difference, you would ask? The difference is the capturing point. You can be capturing the packets buffered for transmission or the transmitted packets. The capturing point could be before the Network Interface or after the Network Interface inside the OS & memory.
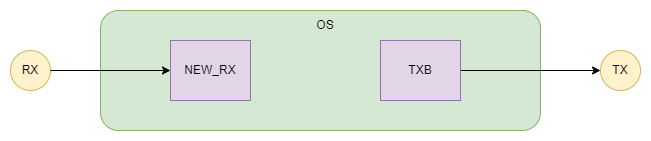
This is extremely valuable when you have doubts if the packet is transmitted. In case where the NetScaler experiences an issue after the buffering of the packet and drops it instead of transmitting it. Generally Packet Loss Issues.
To investigate such an issue, you’ll need to enable both modes. This will result in seeing the captured packets twice. Wireshark’s interpretation of traffic again will be wrong. You’ll need to be able to distinguish traffic captured with TXB + NEW_RX mode and traffic captured with RX + TX modes, so you could compare them.
This information is included by the NetScaler inside the Wireshark trace. You just need to filter it.
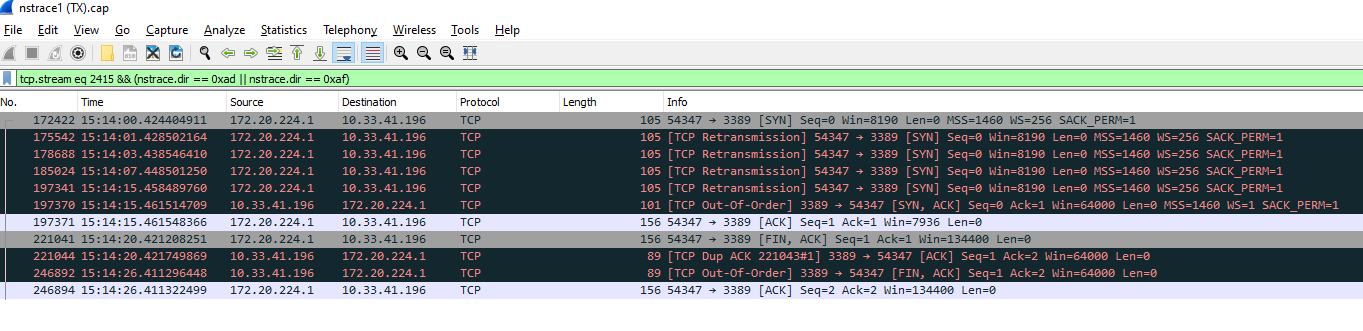
(nstrace.dir == 0xad || nstrace.dir == 0xaf) – Filter Buffered for Transmission
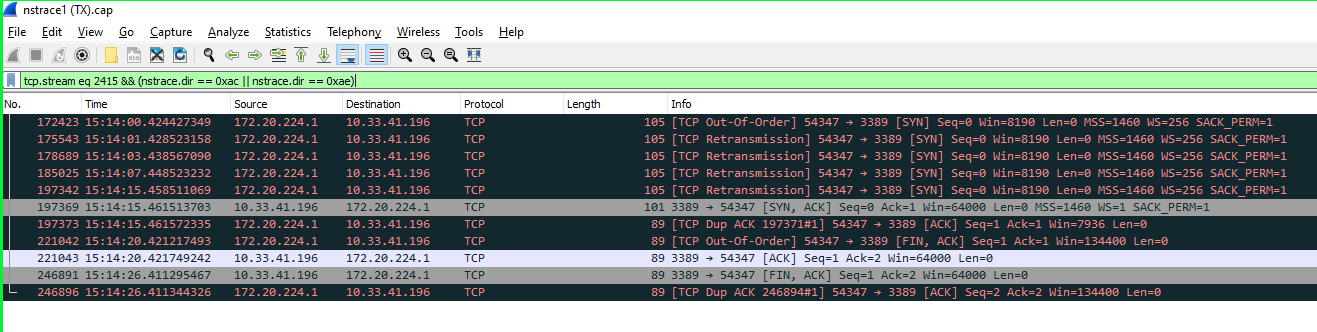
(nstrace.dir == 0xac || nstrace.dir == 0xae) – Filter Received & Transmitted
Note: You cannot filter the capture (inside the NetScaler) when running in RX + TX Mode. You’ll capture all traffic passing through the box. Depending on the situation you would like to enable “Capture dropped packets”.
As you can see from the screenshots below you can no longer rely on the Wireshark’s interpretation of traffic. These are absolutely the same packets and TCP Sessions, captured inside the OS memory VS before and after the Network Interface.
Analysis
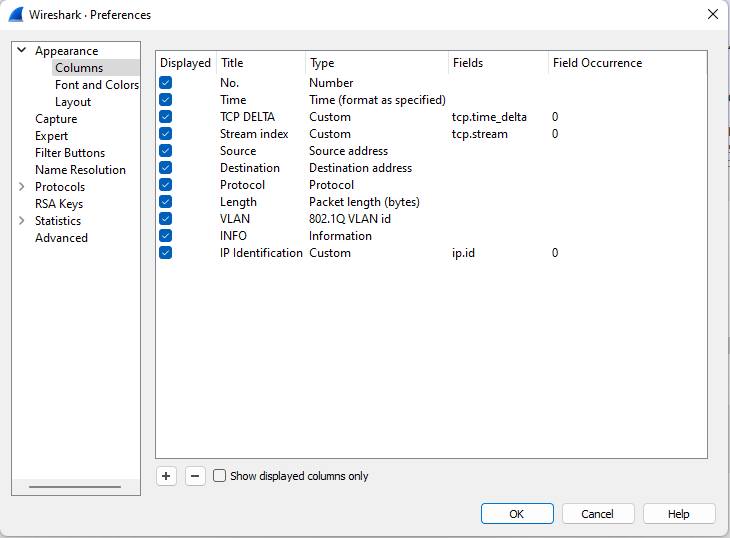
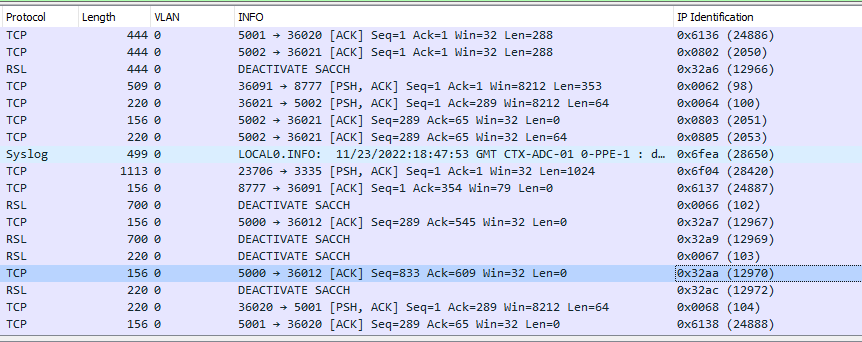
Having inconsistent packet loss on large scale makes examining the situation more difficult - how do you compare the traces? We’ll need to add additional Wireshark column - IP.ID.
The IP.ID purpose is a system to be able to distinguish fragmented packets. It identifies fragmented packets uniquely in a certain context. The Identification field (16 bits) is populated with an ID number unique for the combination of source & destination addresses, source & destination port and protocol field value of the packet. The IP identification field will increase by ‘1’ for every packet from the stream. We’ll use the IP.ID for uniquely identifying the packets.
Filter the trace by capturing mode (TXB + NEW_RX or RX + TX).
Export the trace to CSV and export the IP Identification column from the CSV. (File > Export Packet Dissections)
Repeat for the other capturing mode trace and compare the columns in Notepad ++.
You can apply the same logic for traces taken on different devices. You’ll be able to narrow down where the Packet loss is happening. Below you can see comparison having packet loss and comparison that does not.
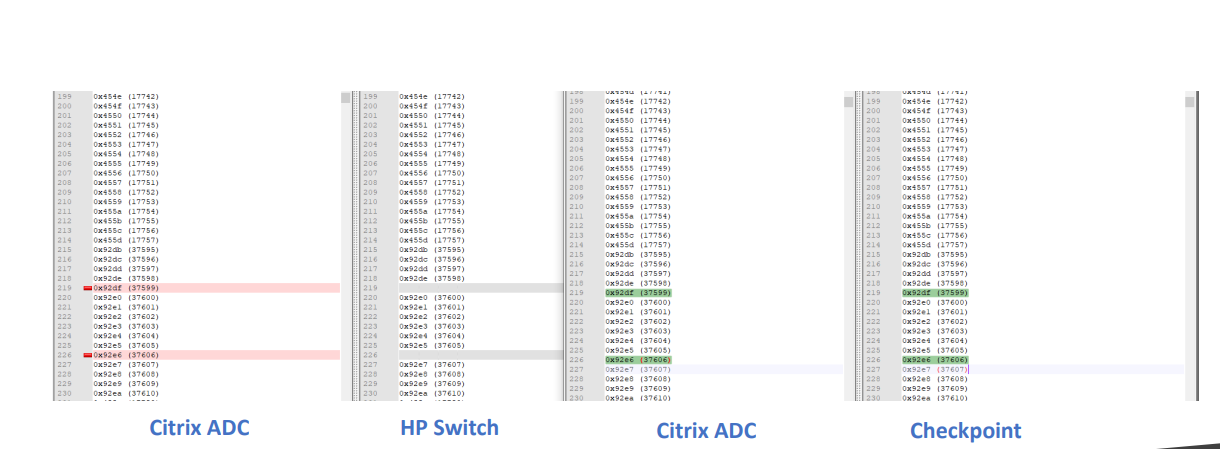
For the sake of this troubleshooting session let’s assume there are differences between our internal traces. This would mean the packet loss is happening on NetScaler and we indeed have dropped packets.
Note: Generally, you want to exclude VLAN 0 from the analysis, but not always. Remember VLAN 0 is internal loopback communication which occasionally includes packet steering. There are issues that could be detected through the loopback network interface! I strongly advise you to analyze VLAN 0 communication if you have indication of high loopback interface traffic!
After the comparison you’ll know which packets from which TCP streams have been dropped. Now we need to find if the NetScaler is generally dropping packets (Packet Engine issues, Internal Latency, License throughput, etc.) or there is a specific reason for dropping specific TCP sessions.
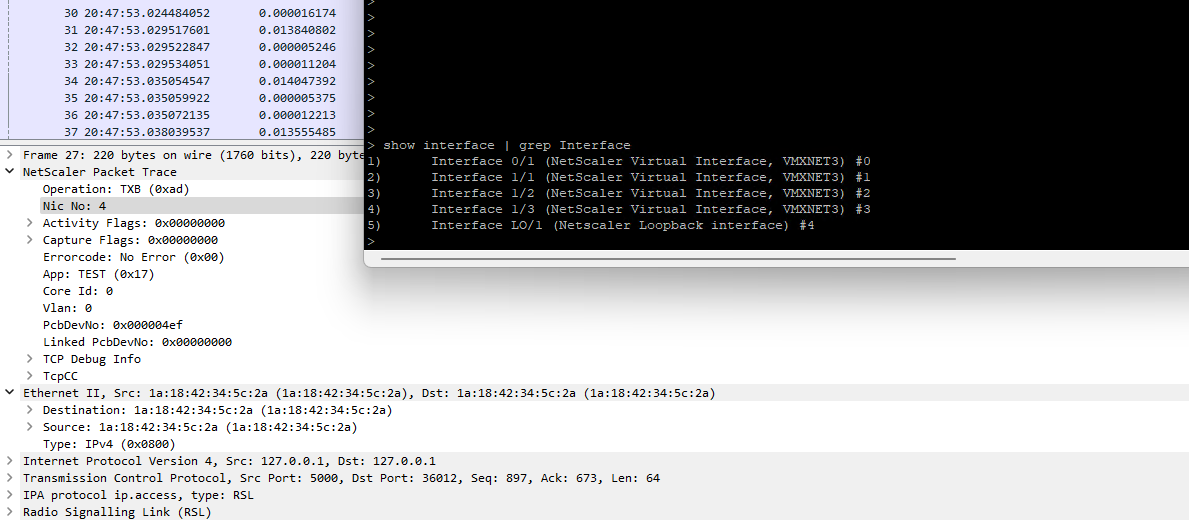
We need to identify the stream of traffic per interface to have a better understanding where the problem is. Each interface has a corresponding number in Wireshark. You can find that number next to the interface as shown below:
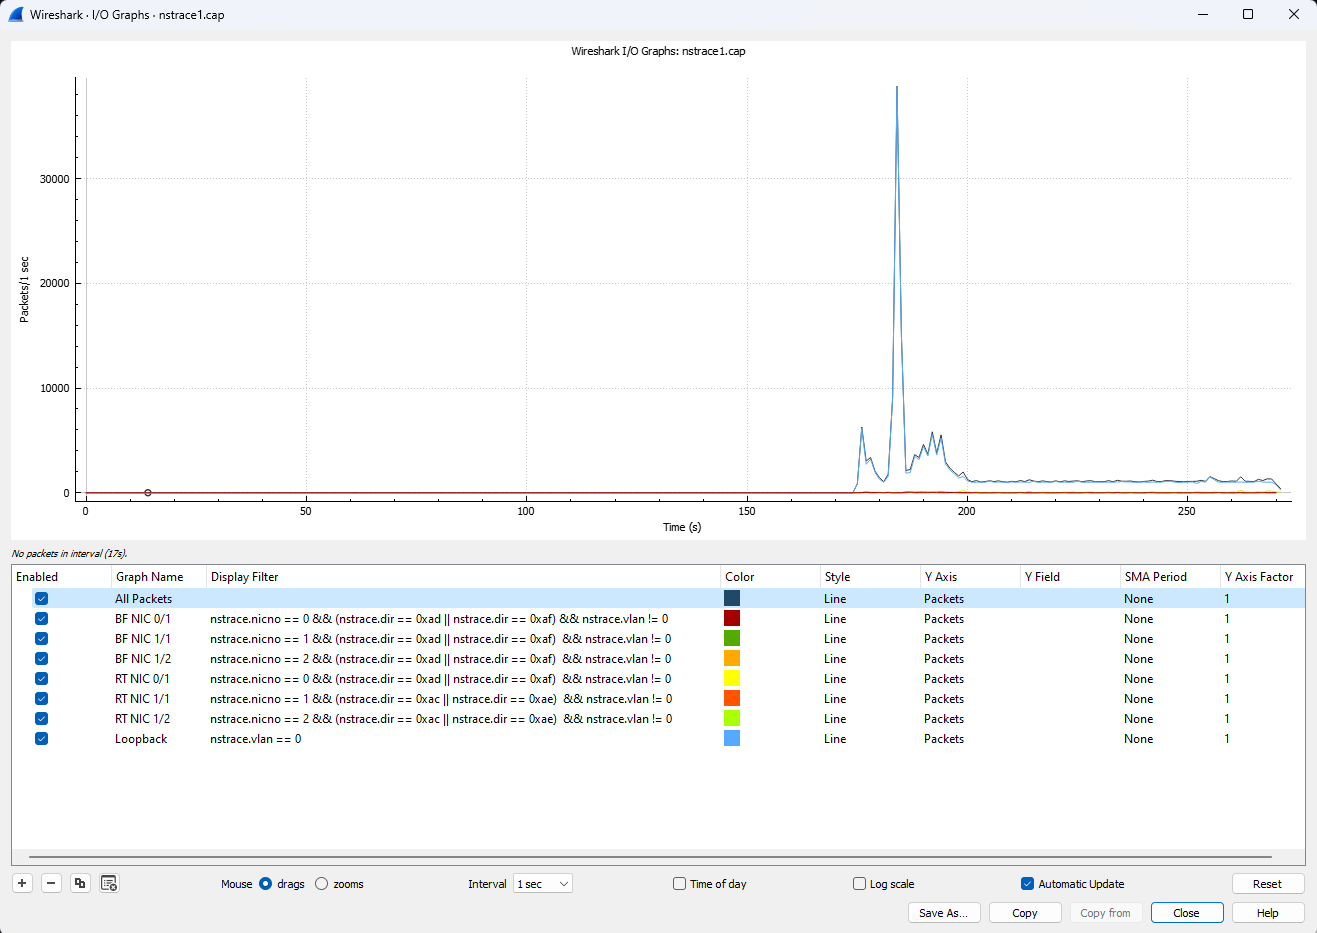
We want to see the data in a graph. Click on Statistics > I/O Graphs.
We’ll need to define the following Display Filters:
BF NIC 0/1 - nstrace.nicno == 0 && (nstrace.dir == 0xad || nstrace.dir == 0xaf) && nstrace.vlan != 0
BF NIC 1/1 - nstrace.nicno == 1 && (nstrace.dir == 0xad || nstrace.dir == 0xaf)  && nstrace.vlan != 0
BF NIC 1/2 - nstrace.nicno == 2 && (nstrace.dir == 0xad || nstrace.dir == 0xaf)  && nstrace.vlan != 0

RT NIC 0/1 - nstrace.nicno == 0 && (nstrace.dir == 0xad || nstrace.dir == 0xaf)  && nstrace.vlan != 0
RT NIC 1/1 - nstrace.nicno == 1 && (nstrace.dir == 0xac || nstrace.dir == 0xae)  && nstrace.vlan != 0
RT NIC 1/2 - nstrace.nicno == 2 && (nstrace.dir == 0xac || nstrace.dir == 0xae)  && nstrace.vlan != 0

Loopback - nstrace.nicno == 4 || nstrace.vlan == 0
You can enhance these filters per your needs. BF stands for Buffered (inside OS memory trace), RT stands for Received/Transmitted trace. You’ll have a nice visual of all traffic passing through the device per interface. The below graph is just an example of idle system, if you have LACP Channels it gets slightly more complicated.
Next step will be to overlap the data with counters from the NetScaler if we have identified an issue on that graph.

You can find below a few counters indicating packet drops, but you can choose any other counter relevant to the situation and the issue you’re experiencing:
- tcp_err_cookie_pkt_seq_drop - SYN cookie packets dropped because the sequence number specified in the packets is outside the current Window.
- tcp_tot_acl_drop - Packets dropped because they match ACLs with processing mode set to DENY.
- tcp_tot_sacl_drop - Packets dropped because they match Deny Simple ACL.
- tcp_tot_sacl6_drop - Packets dropped because they match deny simple ACL6.
- tcp_tot_acl6_drop - Packets dropped because they match IPv6 ACLs with processing mode set to DENY.
- tcp_tot_acl6_drop - Packets dropped because they match IPv6 ACLs with processing mode set to DENY.
- tcp_err_in_congestion_syndropped - SYN packets dropped because of network congestion.
- ip_tot_reass_attempts - IP packets that the NetScaler appliance attempts to reassemble. If one of the fragments is missing, the entire packet is dropped.
- ip_tot_l2_mode_drops - Total number of IP packets dropped due to L2 Mode disabled
- ip_tot_l3_mode_drops - Total number of IP packets dropped due to L3 Mode disabled
- ip_tot_secondary_pe_drops - Total number of IP packets dropped by the Secondary NetScaler appliance
- ip_tot_loopback_drops - Total number of Loopback IP packets dropped
- ip_tot_subnet_bcast_drops - Total number of IP packets dropped due to destination address as subnet broadcast
- ip_err_zero_nexthop - Packets received that contain a 0 value in the next hop field. These packets are dropped.
- ip_err_ttl_expired - Packets for which the time-to-live (TTL) expired during transit. These packets are dropped.
- as_traps_dropped - AppFirewall SNMP traps dropped due to time limit
- tcp_cur_SW - Dropped packets due to TCP small window attack protection feature
- tcp_cur_SW_pcbs - Dropped packets due to TCP small window attack protection feature
- tcp_err_SW_init_pktdrop - Dropped packets due to TCP small window attack protection feature
- cp_err_syn_sentbadack - Bad ACK received
- nic_err_rl_pps_pkt_drops - Packet Drops: EVENT Message 62992 0 : '410 packets dropped due to license'
- nic_err_rl_rate_pkt_drops - Packet Drops: EVENT Message 62992 0 : '410 packets dropped due to license'
In my case I would like to examine the following counter “tcp_err_illegal_server_MAC_update” and overlap it with the Wireshark data:
nsconmsg -K /var/nslog/newnslog -s disptime=1 -d current -g tcp_err_illegal_server_MAC_update
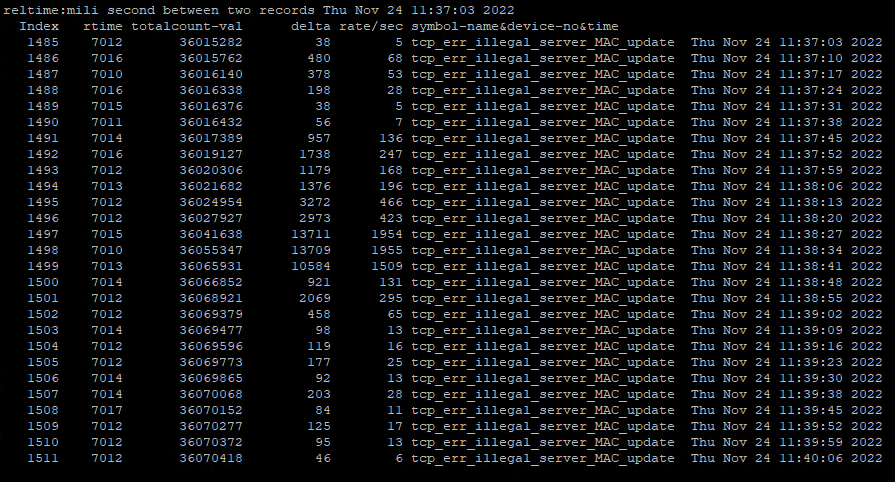
You can export the counter data into CSV:
nsconmsg -K /var/nslog/newnslog -s csv=1 -d current -g tcp_err_illegal_server_MAC_update > MAC.csv
Copy the MAC.csv file locally.
scp /root/MAC.csv username@10.10.10.5:/home/username
Convert/re-save the file to excel format.
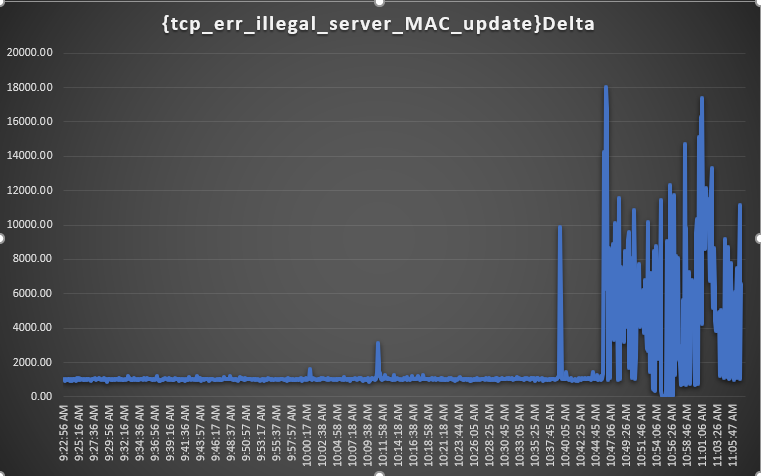
Remove the Columns that you don’t need as Total Counter Numbers & Relative Time. Select the Absolute Time Column (AbsTime) and mark it as Data Type “Time”. Select the Delta Column and mark it as Data Type “Number”.You can delete the informational data above the Columns. Select the two Columns of data. Go to Insert > Recommended Charts > Choose a Chart. You can now have a chart of a specific counter during a time period. Counter visualization could be also accomplished with external tools such as Grafana and Citrix Observability Exporter. Having external tools for processing such data should be something to think about if you're not already doing it.
Excel Visualization shown below
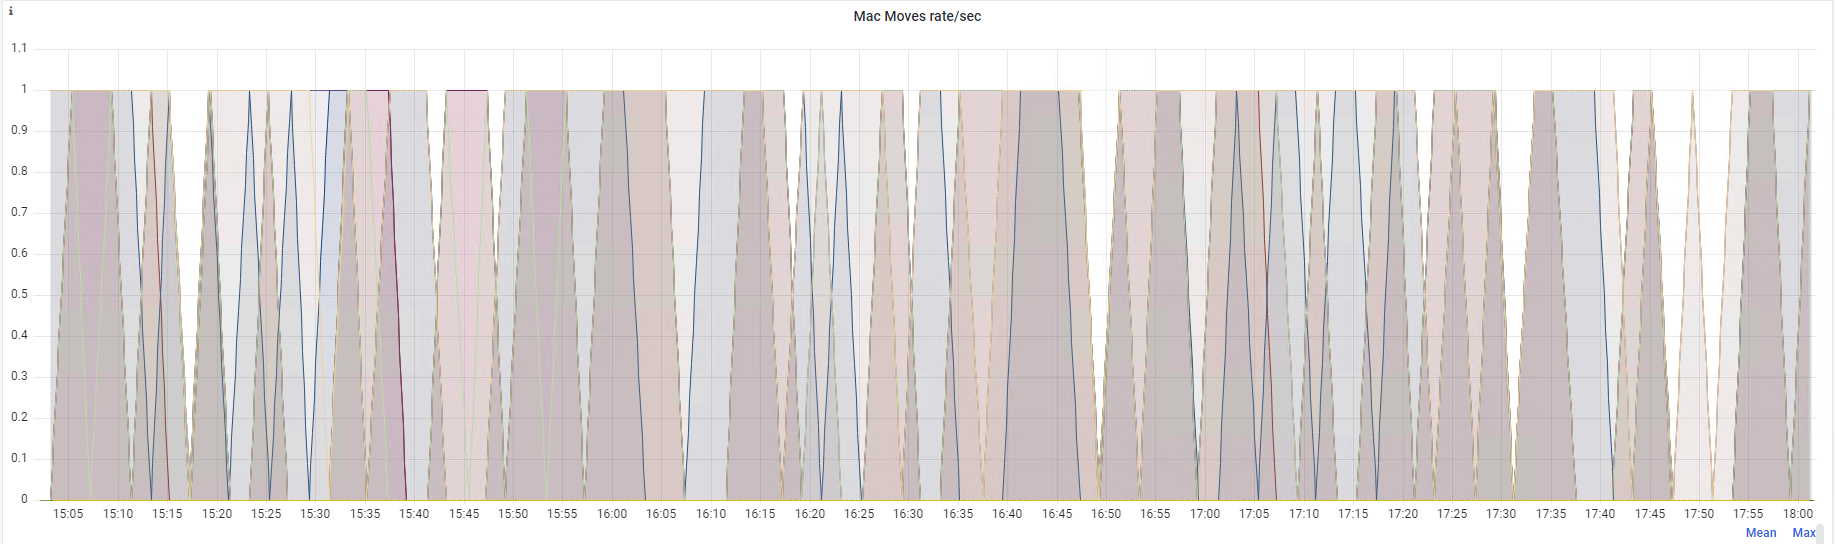
A more convenient way is to have proper time span visualization (MAC Moves counter) in Grafana
Thank you for reading!